Section 7: Our Mapping Method Applied to a Longer Time-Frame Approach
The mapping method can also be applied to longer term trading such as swing or position trading. Exactly the same principles apply as shorter term trading just we calculate levels in the longer term...easy! This is ideal for traders who do not want to devote as much time watching the charts or prefer the less frenetic pace of holding positions open for longer.
Instead of calculating the daily PP of the prior session, we calculate the PP of the prior week. The weekly PP tells us about the longer-term sentiment.
We also calculate HOPS´s and LOPS´s based on the weekly range. HOPS1 and LOPS1 will include the high and low of the previous week, while HOPS2 and LOPS2 will include the range of the week before the last week.
Longer term trend identification

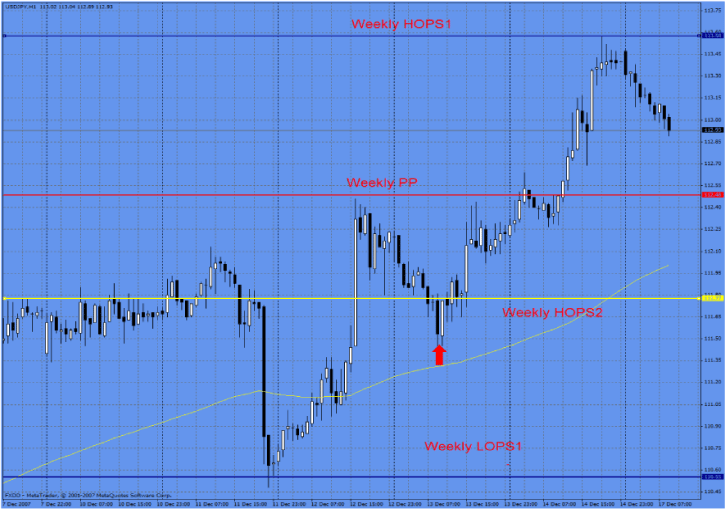
In this Chart, the market is trading above the W-PP, so we know that in the long term, the market has a possible uptrend. Any pattern in direction of the trend would signal a long trade. Short trades could be taken only from HOPS1 or if the market breaks below the W-PP.
Trades off important levels
For obvious reasons, the stop and target levels need more room when using this kind of approach.

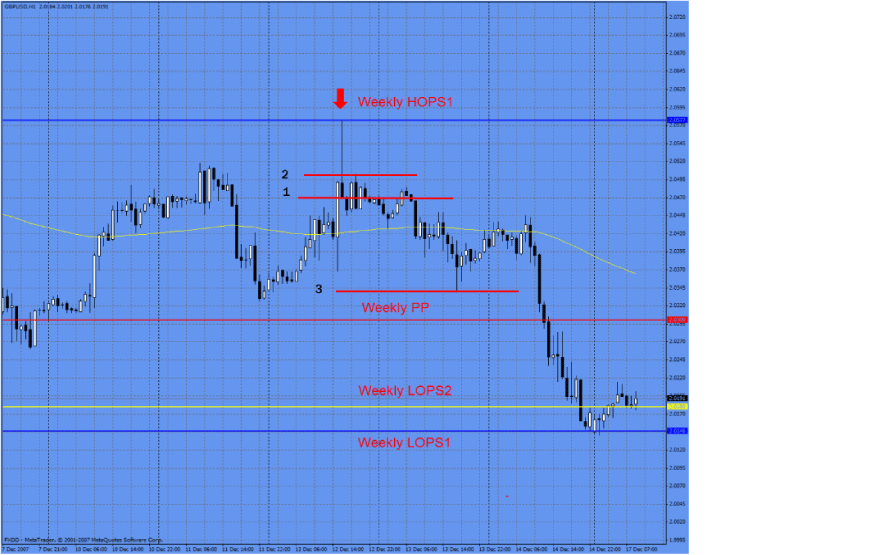
In this chart we see a great Shooting Star off the W-HOPS1, a perfect signal to trade against the possible trend (the market reaches the TP level located around W-LOPS1).
As we can see, the same methodology is used when trading the longer term as the one used for short term trading. Some people we have taught use both short and longer term approaches depending on their time availability and mood. It is quite straightforward as the skills and strategy used for one can directly be transferred to the other – Good luck with whatever your choice.
The mapping method can also be applied to longer term trading such as swing or position trading. Exactly the same principles apply as shorter term trading just we calculate levels in the longer term...easy! This is ideal for traders who do not want to devote as much time watching the charts or prefer the less frenetic pace of holding positions open for longer.
Instead of calculating the daily PP of the prior session, we calculate the PP of the prior week. The weekly PP tells us about the longer-term sentiment.
We also calculate HOPS´s and LOPS´s based on the weekly range. HOPS1 and LOPS1 will include the high and low of the previous week, while HOPS2 and LOPS2 will include the range of the week before the last week.
Longer term trend identification

[Chart 1]
In this Chart, the market is trading above the W-PP, so we know that in the long term, the market has a possible uptrend. Any pattern in direction of the trend would signal a long trade. Short trades could be taken only from HOPS1 or if the market breaks below the W-PP.
Trades off important levels
For obvious reasons, the stop and target levels need more room when using this kind of approach.

[Chart 2]
In this chart we see a great Shooting Star off the W-HOPS1, a perfect signal to trade against the possible trend (the market reaches the TP level located around W-LOPS1).
As we can see, the same methodology is used when trading the longer term as the one used for short term trading. Some people we have taught use both short and longer term approaches depending on their time availability and mood. It is quite straightforward as the skills and strategy used for one can directly be transferred to the other – Good luck with whatever your choice.

Post a Comment Blogger Facebook